Like many others, I have historically used SPSS as my go-to data management program. Many of those with whom I work do the same, and with good reason. It’s flexible and fairly easy to use for basic data management tasks (and let’s be honest, most people are trained in SPSS during their initiation into data analysis in psychology). One life changing moment for many users of SPSS is the day that one realizes the utility of the syntax window vis a vis the point and click interface. This becomes more apparent during the data management phase than perhaps at any other point. This article assumes that you’re already past this point of no return.
So, now that you’ve gotten used to using the syntax editor to carry out your tasks in SPSS, I’ll share a few simple ways to make the experience of data management even easier (and more error-proof). It’s all done with the help of one of my other favorite programs – Excel.
I’ll start by saying this — if you aren’t familiar with Excel, get familiar with Excel. Seriously. At first glance it seems like a fairly unspectacular spreadsheet program, designed primarily for accounting tasks like preparing taxes come Spring, or drawing up inventories, or keeping track of your softball team roster & player stats. Sure it can be useful for those sorts of things. But a bit of adventurous fiddling about will quickly alert you to the myriad possibilities lurking beneath Excel’s austere hood. I won’t walk you through the countless functions and hacks that Excel offers (because that would take an exorbitant amount of time to achieve, and I frankly don’t know them all). Instead, I’ll introduce you to a handful that, when married with SPSS syntax commands, make data management tasks a breeze and a half.
Let’s approach this by way of a recoding example.
Recoding Variables – An overview.
Many of the measures used in research contain items that have raw values that are either counter-intuitive (e.g., negatively scored items) or have unclear, arbitrary quantitative interpretations (e.g., a gender variable where 1=”male” and 2=”female”). In either case, it’s often in your best interest to recode the variables associated with such measures. One of the most common types of recoding procedures that I tend to use are linear transformations.
Linear transformations in the data management context generally involve taking an entire scale and adjusting the value of every point in the same exact fashion (one of the best known examples of this in the context of regression analysis is mean-centering). As an illustrative example, suppose I have data from a 33-item measure of the frequency of certain types of stressful events during the past month (let’s call it the EVENT scale – I have no idea what EVENT stands for. Just go with it). Suppose the scale is scored such that 1 = “Never happened”, and 5 = “Happened almost every day.” It might be more useful and intuitive in this case for me to recode these scores such that they each have a meaningful zero point – namely, that “Never happened” is equal to zero. A linear transformation can help here.
The SPSS syntax to recode item 1 in this scale might look something like this (I tend to use the ‘r’ suffix to indicate a variable that has been recoded from its original metric):
COMPUTE EVENT1r = EVENT1-1.
Now I could go ahead and write that line 32 more times to account for every item in the EVENT scale, but that would be horribly inefficient. Alternatively, I could copy and paste that line of syntax 32 times, then proceed line-by-line changing the item numbers consecutively until I reach the “EVENT33r” item. Slightly less inefficient, but still pretty tedious. More importantly, both methods leave a lot of room for human error. If I’m taking either approach during a long night, there’s a chance that I might accidentally type something stupid like “EVENT7 = EVENT7-1” and end up overwriting my original variable. We don’t want that. Instead I take the Excel approach. Here’s how I do it.
The Excel Approach
This method relies primarily on three features in Excel. The first is the often life-saving text-to-columns feature. The second is the built-in automatic numbering/filling feature that operates across a variety of cell contents. The last is the concatenation function – a fancy-sounding term for “take all of these text characters and smash them together into one continuous string of text.” I’ll explain how all three tie into creating sequential lines of syntax for a recode.
First, I write my COMPUTE statement in Excel, inside a single cell. Then I run the text-to-columns procedure on my COMPUTE statement. In short, this procedure lets you take the contents of a cell (or column of cells) and distribute it across multiple rows however you’d like (it’s effectively the opposite of concatenation). I ensure that I separate the COMPUTE statement into segments that are sequential (i.e., the ascending item numbers) versus segments that are redundant across statements (i.e., everything else).
Note that I strategically add spaces to my cell contents as well, so the COMPUTE statement makes sense when it comes out on the other end. For example, the first cell contains the text “COMPUTE ” — this is meaningfully different from writing “COMPUTE” with no spacing. You’ll see why when we get to the concatenation step below.
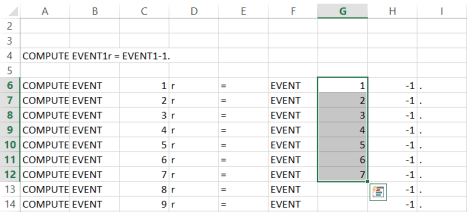
Another quick note – certain characters here might cause Excel to yell at you. In this particular example I’m referring to the “=” sign in cell E6 (see the image below). In some versions of Excel, a cell with an equals sign in it will make Excel think you have a blank formula. Simply add an apostrophe before the equals sign to fix this error (i.e., instead of entering = just enter ‘= into the cell.) In the newer version of Excel 2013 I haven’t had this issue, but in all previous versions I’ve needed the trailing apostrophe. Once goofy characters like this are fixed, your statement is successfully split.
Once the statement is split, I’ll need to fill in numbers for the sequential parts of the COMPUTE statement. To do this, I simply utilize Excel’s auto-filling feature, by quickly adding the number 2 to cells C7 and G7. Then, I select cells C6 and C7, and I drag this selection downward until I have the desired number for my items. I repeat this step with cells G6 and G7. Excel will automatically number each item as you proceed (isn’t technology fun?). For the redundant parts of the statement, simply copy and paste the contents of each redundant-syntax cell from row 6 into the cells beneath (here, that’d be cells A6, B6, D6, E6, H6, and I6). The end result looks something like this (in progress):
Lastly, I need to take those lines and jam each one back together into a functional set of commands for SPSS. To do that, I use the concatenate function in a new cell to the immediate right of my first COMPUTE statement (cell J6 below). When doing this, I effectively tell Excel to take the contents of all the cells to the left of this cell and mash them into one string of text. That command looks like this:
=CONCATENATE(A6,B6,C6,D6,E6,F6,G6,H6,I6)
After doing this, ensure that your final concatenated COMPUTE statement looks sensible. If not, you may need to go back in and add spacing to certain parts of the statement or fix other things as desired. Once you have things in order, utilize the auto-filling feature again by selecting your concatenate cell, and dragging downward to fill in COMPUTE statements for each existing line (Excel also automatically carries cell formulas downward, based on the pattern you specify. Again, isn’t technology fun?). The end result looks like this:
 Now, remember when I mentioned adding spacing to my statements strategically? Here’s why. Without spacing, the concatenate statement above would have produced the following commands for SPSS.
COMPUTEEVENT1r=EVENT1-1.
COMPUTEEVENT2r=EVENT2-1.
... etc.
Obviously, this is a problem. SPSS has no idea what the hell “COMPUTEEVENT1r” means so your statements wouldn’t actually result in any useful commands being carried out. So do be aware of the little things.
Barring those little oddities, once you have your list of syntax commands successfully concatenated, you can copy them and paste them right back into the SPSS syntax window. Highlight them in SPSS, click “Run,” and bask in the glory of your recoded EVENT variables… whatever EVENT stands for (you might want to add an “EXECUTE.” line as well, just so SPSS gets going.).
There you have it. Now you might be thinking to yourself “Wow, that was a whole lot of explanation and a bunch of steps for a supposedly quicker method. Maybe I should just type stuff line by line and ignore this nonsense.” Fair enough. This is one of those things that takes much longer to explain than it does to implement. Especially once you’re comfortable with this procedure. With practice, this procedure actually takes only a few seconds.
Once you’ve developed the mastery, you can (and hopefully will) use these sorts of Excel tricks to greatly expedite your data management tasks. It can be applied to variable labeling, recodes, value labeling, renaming statements, and lots more. It can be useful in other data management and analysis programs that are syntax-friendly. It can also be a great way to speed up similar procedures conducted across different sets of variables. For example, if I wanted to do something similar to a 22-item anxiety scale, I might simply go back into the same Excel sheet I used above, and:
1. Replace the word “EVENT” with “ANX” in cells B6 and F6.
2. Highlight both of these cells respectively and drag the selection downward until item 22. The concatenated statements would all change accordingly.
3. Paste these 22 statements into SPSS, run them, and get 22 recoded anxiety items.
4. Coffee.
If I find the time in the coming weeks, I might create and upload a sheet that makes this a bit easier for those who don’t want to bother learning the Excel commands. Maybe. I’m honestly a big advocate of learning these and other handy commands, so I’m somewhat reluctant to deprive anyone of the learning opportunity. Knowing how to use these sorts of tricks is a valuable tool in the researcher’s arsenal when it comes to working with your data. Truly. So give it a shot.
Happy data managing.

Pingback: Basics: How SPSS syntax will change your life. | Fred Clavel
Pingback: Intro Topics: Working with SPSS Syntax & Scale Creation | Fred Clavel